Grafana 提供了許多工具讓維運團隊能很清楚的知道系統的相關狀態,針對網頁相關效能的監控,也有提供相關的 solution,就是 Faro
Grafana Faro 的運作方式如下圖,

前端開發可以透過提供的 SDK 將相關資訊傳到後面的 Agent/Collect ,就完成了。只是 SDK 雖然簡單套用,裡面有很多細節設定是需要深入研究的,這篇就是這些設定的學習筆記
Faro Web SDK
@grafana/faro-web-sdk provides instrumentations, metas and transports for use in web applications,安裝使用方法如下
-
安裝
faro-web-sdk1
npm i @grafana/faro-web-sdk
-
initialize
1
2
3
4
5
6
7
8
9
10
import { initializeFaro } from '@grafana/faro-web-sdk';
const faro = initializeFaro({
url: 'https://collector-host:12345/collect',
apiKey: 'secret',
app: {
name: 'frontend',
version: '1.0.0',
},
});url: Grafana Agent 的位置apiKey: 對應到 Grafana Agent 的integrations.app_agent_receiver_configs下的server.api_key設定app: Web Application 的 meta 資訊,會用於 Grafana Dashboard 上
-
當這樣設定完成後,開啟網頁時,在 network 的地方就會看到 SDK post 相關資訊到設定的 agent 位置
基本用法
當遇到需要手動推送資訊時,SDK 也有提供對應的 API 接口
-
手動推送 log
1
2
3
4
5
6
7
8
9
10
11
12
13
14
// send a log message
// by default info, warn and error levels are captured.
// trace, debug and log are not
console.info('Hello world', 123);
// or
faro.api.pushLog(['Hello world', 123], { level: LogLevel.Debug });
// log with context
faro.api.pushLog(['Sending update'], {
context: {
payload: thePayload,
},
level: LogLevel.TRACE,
}); -
手動送 Exception
1
faro.api.pushError(new Error('everything went horribly wrong'));
-
手動送 Event
1
faro.api.pushEvent('navigation', { url: window.location.href });
-
手動送
meaurement1
2
3
4
5
6
7faro.api.pushMeasurement({
type: 'cart-transaction',
values: {
delay: 122,
duration: 4000,
},
}); -
pause/resume Faro
1
2
3
4
5
// pause faro, preventing events from being sent
faro.pause();
// resume sending events
faro.unpause();
學習筆記
-
Faro SDK 預設會忽略短時間內相同訊息的事件,不會每一筆都往後面送,如果想要改變這行為,可以設定
dedupe: false(dedupe: A flag for toggling deduplication filter) -
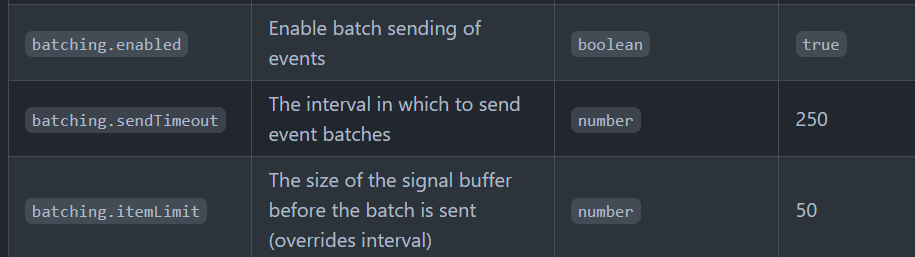
預設是採 batch sending 的模式,每 250 ms 或是每 50 筆送一次,這些數值也可以設定
-
上一段提到的手動送資訊到後面的 API,都有額外的參數可以設定,細節可以參閱這邊
-
很多 SDK 的使用細節說明都寫在
faro-core的地方,README 有此去 -
預設有提供
faro-react,其他 framework 如果想要實作類似的效果,可以參考 react 的版本,包含的項目有- Error Boundary - Provides additional stacktrace for errors
- Component Profiler - Capture every re-render of a component, the un/mounting time etc.
- Router (v4-v6) integration - Send events for all route changes
- SSR support
以 Angular 來說,應該也可以做到 1~3 點,但我還沒有自己動手實作過,先暫定可以好了
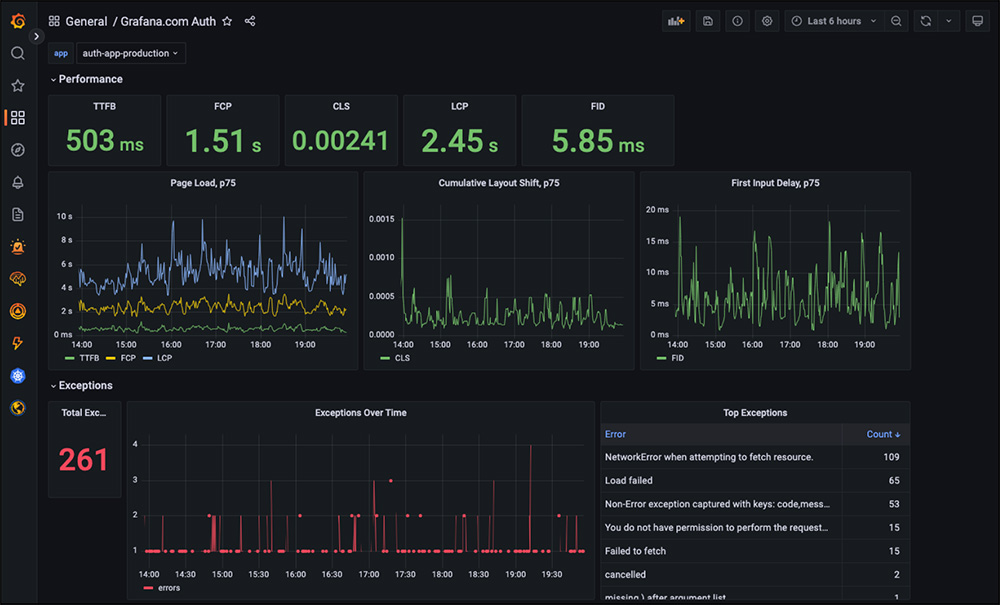
小結
Faro 提供的是 RUM (Real User Monitoring) 的相關資訊,除了 Grafana,Kibana 和 Sentry 都有提供類似的功能,只是因為自家的 Monitor stack 是 Grafana 為主,所以選擇 Faro 只是為了讓使用的工程師不用在工具中切來切去
前端效能調教水很深,收集到的這些資訊並不會有 Web 在產生畫面的相關資訊,那些需要回到瀏覽器上做分析,背後的 web vita API 可以參考這一個套件 web-vitals